DOPE Whitepaper
Our mission is complete transparency. This document explains how we collect market data, compute metrics, and generate signals to provide you with real-time market intelligence.
Our Mission
DOPE (Depth of Perpetuals Engine) exists to democratize access to institutional-grade market intelligence. Our mission is to help traders of all levels see what the whales see by providing transparent, real-time insights into market structure, order flow, and price movements across multiple exchanges.
Transparency First
No Black Boxes
How We Collect Data
DOPE connects to multiple cryptocurrency exchanges to collect real-time market data. We use public data feeds that are available to anyone—no special access or privileged relationships required.
Data Sources
We currently monitor the following exchanges:
- Binance: Spot and Perpetuals (USDⓈ-M) markets
- Bybit: V5 perpetuals markets
- OKX: Perpetuals markets
- Hyperliquid: Perpetuals markets
For each exchange, we collect two types of data:
Order Book Data
Real-time snapshots and incremental updates of the order book, showing all active buy and sell orders at various price levels. This data is publicly available through each exchange's WebSocket API.
Trade Data
Real-time trade executions showing price, size, and timestamp for every completed trade. This helps us understand actual market activity and order flow.
Important: We only use publicly available data. We do not have access to private order information, user accounts, or any privileged data. Everything we show you is derived from data that anyone can access.
How We Compute Metrics
Once we collect the raw order book and trade data, we compute various metrics in real-time to help you understand market structure and trading pressure. Here's how we calculate the key metrics you see:
Understanding Basis Points (bps)
What is 1 Basis Point (1 bps)?
1 basis point (bps) = 0.01% = 0.0001
Basis points are a standard unit for measuring small price changes in financial markets. They provide precision for movements that might seem tiny but can be significant in trading.
- 1 bps = $90,000 × 0.0001 = $9.00
- 10 bps = $90,000 × 0.001 = $90.00
- 100 bps = $90,000 × 0.01 = $900.00 (1%)
When we say "Depth Bid (1bps)", we're measuring the total order volume within $9 of the best bid price (for BTC at $90,000). This tells you how much buying support exists very close to the current price.
Depth Metrics
Depth metrics measure how much order volume exists at specific price ranges around the current best bid/ask prices.
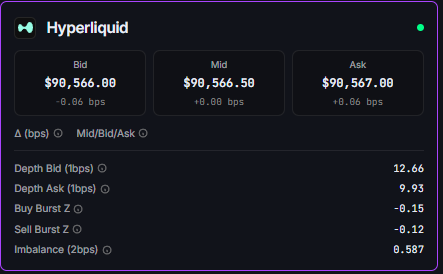
Depth Bid (1bps)
Calculation: Sum all buy orders within 1 basis point (0.01%) of the best bid price.
This tells you how much buying support exists very close to the current price. Higher values indicate stronger support levels where price might find a floor.
Depth Ask (1bps)
Calculation: Sum all sell orders within 1 basis point (0.01%) of the best ask price.
This shows how much selling pressure exists near the current price. Higher values indicate stronger resistance levels where price might stall.
Imbalance (2bps)
Calculation: Ratio of bid volume to total volume (bid + ask) within 2 basis points.
This metric indicates directional pressure in the order book:
- Values > 0.5: More buy orders than sell orders → upward pressure
- Values < 0.5: More sell orders than buy orders → downward pressure
- Values ≈ 0.5: Balanced order book → neutral
Buy/Sell Burst Z-Scores
Calculation: Statistical Z-score comparing current trading volume to a rolling baseline average.
These metrics detect unusual trading activity. A Z-score above 2 or below -2 indicates statistically significant deviation from normal trading patterns, which can signal important market events.
How We Generate Signals
Signals are real-time alerts about significant order flow events. We detect two main types of patterns: sweeps and absorptions.
Signal Detection Process
Our signal engine analyzes order book changes and trade flow to identify patterns that often precede significant price movements. Here's how it works:
Sweeps (Swp↑/Swp↓)
Detection: We monitor when large orders "sweep" through multiple price levels in the order book, clearing out liquidity at several consecutive levels.
When an order removes multiple levels of liquidity quickly, it indicates strong directional intent. A sweep upward (Swp↑) suggests aggressive buying, while a sweep downward (Swp↓) suggests aggressive selling.
Currently available for: Binance Perpetuals (USDⓈ-M) markets. More exchanges coming soon.
Absorptions (Abs↑/Abs↓)
Detection: We identify when large orders are placed but quickly absorbed by the order book without causing significant price movement.
This pattern reveals hidden liquidity—large orders that exist in the book but don't move price. An absorption can indicate that significant support or resistance exists at that price level.
Currently available for: Binance Perpetuals (USDⓈ-M) markets. More exchanges coming soon.
Transparency Note: Our signal detection algorithms analyze order book changes and trade flow patterns. We use configurable thresholds to identify significant events while filtering out normal market noise. The exact parameters may evolve as we refine our detection methods, but we always aim to provide clear, actionable signals based on observable market data.
Lead-Lag Pattern Detection
One of DOPE's core capabilities is detecting lead-lag patterns— situations where a price movement on one exchange (the leader) is followed by a similar movement on another exchange (the follower) within milliseconds to seconds.
How It Works
- Jump Detection: We monitor price movements on each exchange and detect "jumps" when price changes exceed a configurable threshold (measured in basis points).
- Pattern Matching: When a jump occurs on one exchange, we check other exchanges for similar jumps within a time window (typically 2 seconds).
- Validation: We validate lead-lag relationships by checking that movements are in the same direction and have similar magnitudes.
- Event Generation: Validated patterns are packaged as lead-lag events showing which exchange led, which followed, the time difference (lag), and the magnitude of movements.
This helps you identify when information flows from one exchange to another, which can indicate arbitrage opportunities or impending price movements across markets.
What We Don't Do
To maintain complete transparency, it's important to clarify what DOPE does not do:
- We don't trade: DOPE is a market intelligence platform, not a trading bot. We provide information; you make the trading decisions.
- We don't have privileged access: All data we collect is publicly available. We have no special relationships or insider information.
- We don't guarantee profits: Market intelligence helps inform decisions, but trading always involves risk. Past patterns don't guarantee future results.
- We don't sell APIs (yet): Currently, DOPE is available through our web interface. API access may be available in the future, but we're focused on building the best possible user experience first.