Order Book Depth Analysis
Order book depth analysis helps you understand market liquidity and potential price support/resistance levels. DOPE calculates several depth metrics to give you insights into market structure and trading pressure.
What is Order Book Depth?
Order book depth measures the total volume of buy and sell orders at various price levels. High depth indicates strong liquidity and potential support/resistance, while low depth suggests thin markets where prices can move quickly.
DOPE analyzes depth within specific price ranges (measured in basis points from the best bid/ask) to provide actionable insights. This helps you understand where large orders might be resting and where price might find support or resistance.
Understanding Basis Points (bps)
What is 1 Basis Point (1 bps)?
1 basis point (bps) = 0.01% = 0.0001
Basis points are a standard unit for measuring small price changes in financial markets. They provide precision for movements that might seem tiny but can be significant in trading.
Real-World Example:
If BTC is trading at $90,000:
- 1 bps = $90,000 × 0.0001 = $9.00
- 10 bps = $90,000 × 0.001 = $90.00
- 100 bps = $90,000 × 0.01 = $900.00 (which is 1%)
So when we say "Depth Bid (1bps)", we're measuring the total order volume within $9 of the best bid price (for BTC at $90,000). This tells you how much buying support exists very close to the current price.
Depth Metrics Explained
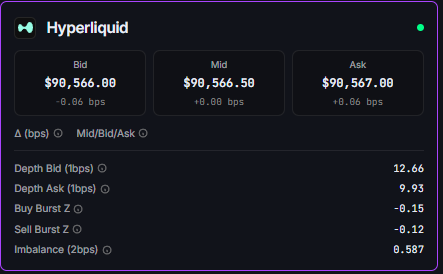
Depth Bid (1bps)
Total buy order volume within 1 basis point of the best bid price. Higher values indicate stronger buy-side support. This metric helps identify where buyers are willing to step in.
Depth Ask (1bps)
Total sell order volume within 1 basis point of the best ask price. Higher values indicate stronger sell-side resistance. This metric helps identify where sellers are willing to step in.
Imbalance (2bps)
The ratio of bid volume to ask volume within 2 basis points. This metric indicates directional pressure in the order book.
- Values > 0.5: More buy orders than sell orders - suggests upward pressure
- Values < 0.5: More sell orders than buy orders - suggests downward pressure
- Values ≈ 0.5: Balanced order book - neutral
Buy/Sell Burst Z-Scores
Burst Z-scores measure unusual trading volume relative to a baseline. They help identify when trading activity deviates significantly from normal patterns, which can signal important market events.
Buy Burst Z
Measures unusual buying activity. Positive values indicate above-average buy volume.
- Z > 2: Significant buy pressure
- Z < -2: Below-average buying
- Z ≈ 0: Normal buying activity
Sell Burst Z
Measures unusual selling activity. Positive values indicate above-average sell volume.
- Z > 2: Significant sell pressure
- Z < -2: Below-average selling
- Z ≈ 0: Normal selling activity
How Z-Scores Are Calculated
DOPE maintains a rolling baseline of trading volume over a configurable time window (default: 900 seconds). The Z-score compares current volume to this baseline, with values above 2 or below -2 indicating statistically significant deviations. This helps filter out normal market noise and focus on meaningful volume spikes.
Using Depth Metrics in Trading
Support/Resistance Levels
High depth on the bid side suggests support levels where price might bounce. High depth on the ask side suggests resistance where price might stall. Combine this with lead-lag patternsfor confirmation.
Liquidity Assessment
Low depth values indicate thin markets where large orders can cause significant price impact. High depth suggests liquid markets where you can execute larger orders with minimal slippage.
Directional Bias
Imbalance metrics help identify directional bias. When combined with sweep and absorption signals, you can get a clearer picture of market sentiment and potential price direction.