Lead-Lag Pattern Detection
Lead-lag patterns occur when a price movement on one exchange (the leader) is followed by a similar movement on another exchange (the follower). DOPE detects these patterns in real-time to help you spot arbitrage opportunities and predict price movements.
What Are Lead-Lag Patterns?
In cryptocurrency markets, price movements don't happen simultaneously across all exchanges. When new information enters the market or large orders execute, one exchange often moves first, followed by others. This creates a lead-lag relationship.
DOPE monitors multiple exchanges including Binance, Bybit, OKX, and Hyperliquidto detect these patterns. When a significant price jump occurs on one exchange, DOPE watches for similar movements on other exchanges within a configurable time window.
How DOPE Detects Lead-Lag Patterns
1Jump Detection
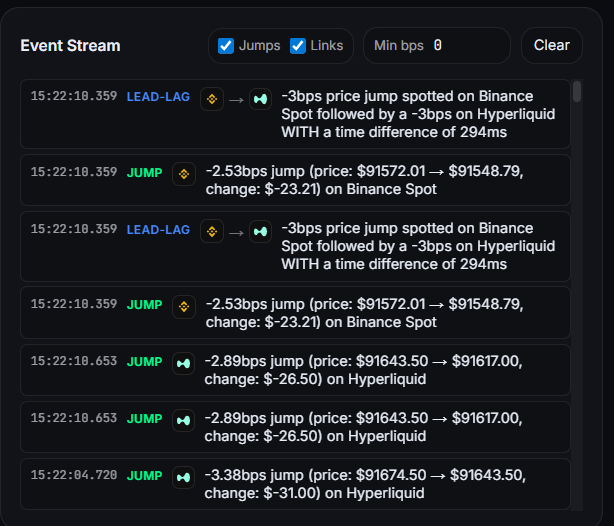
DOPE continuously monitors price movements on each exchange. When a price change exceeds the configured threshold (default: 5 basis points), it's flagged as a "jump."
2Pattern Matching
When a jump is detected on one exchange (the leader), DOPE enters a "follow window" (default: 2000ms) where it watches other exchanges for similar price movements.
3Event Creation
When a matching pattern is found, DOPE creates a "Link" event showing the leader venue, follower venue, lag time, and magnitude of both movements.
Understanding Key Metrics
Basis Points (bps)
Lag Time
The time difference between the leader and follower price movements, measured in milliseconds. Shorter lag times often indicate stronger market efficiency or arbitrage activity.
Magnitude Ratio
Direction
Trading Applications
Lead-lag patterns have several practical applications for traders:
Arbitrage Opportunities
When you see a price jump on one exchange, you can anticipate similar movements on others. This can help identify arbitrage opportunities or time your entries on slower-moving exchanges.
Market Efficiency Analysis
Consistently short lag times between exchanges indicate efficient price discovery. Longer lags may suggest liquidity differences or information asymmetry.
Price Prediction
If Exchange A consistently leads Exchange B, you can use movements on A to predict movements on B. However, past performance doesn't guarantee future results.