Getting Started with DOPE

Welcome to DOPE! This guide will help you understand the platform and start analyzing market data in minutes.

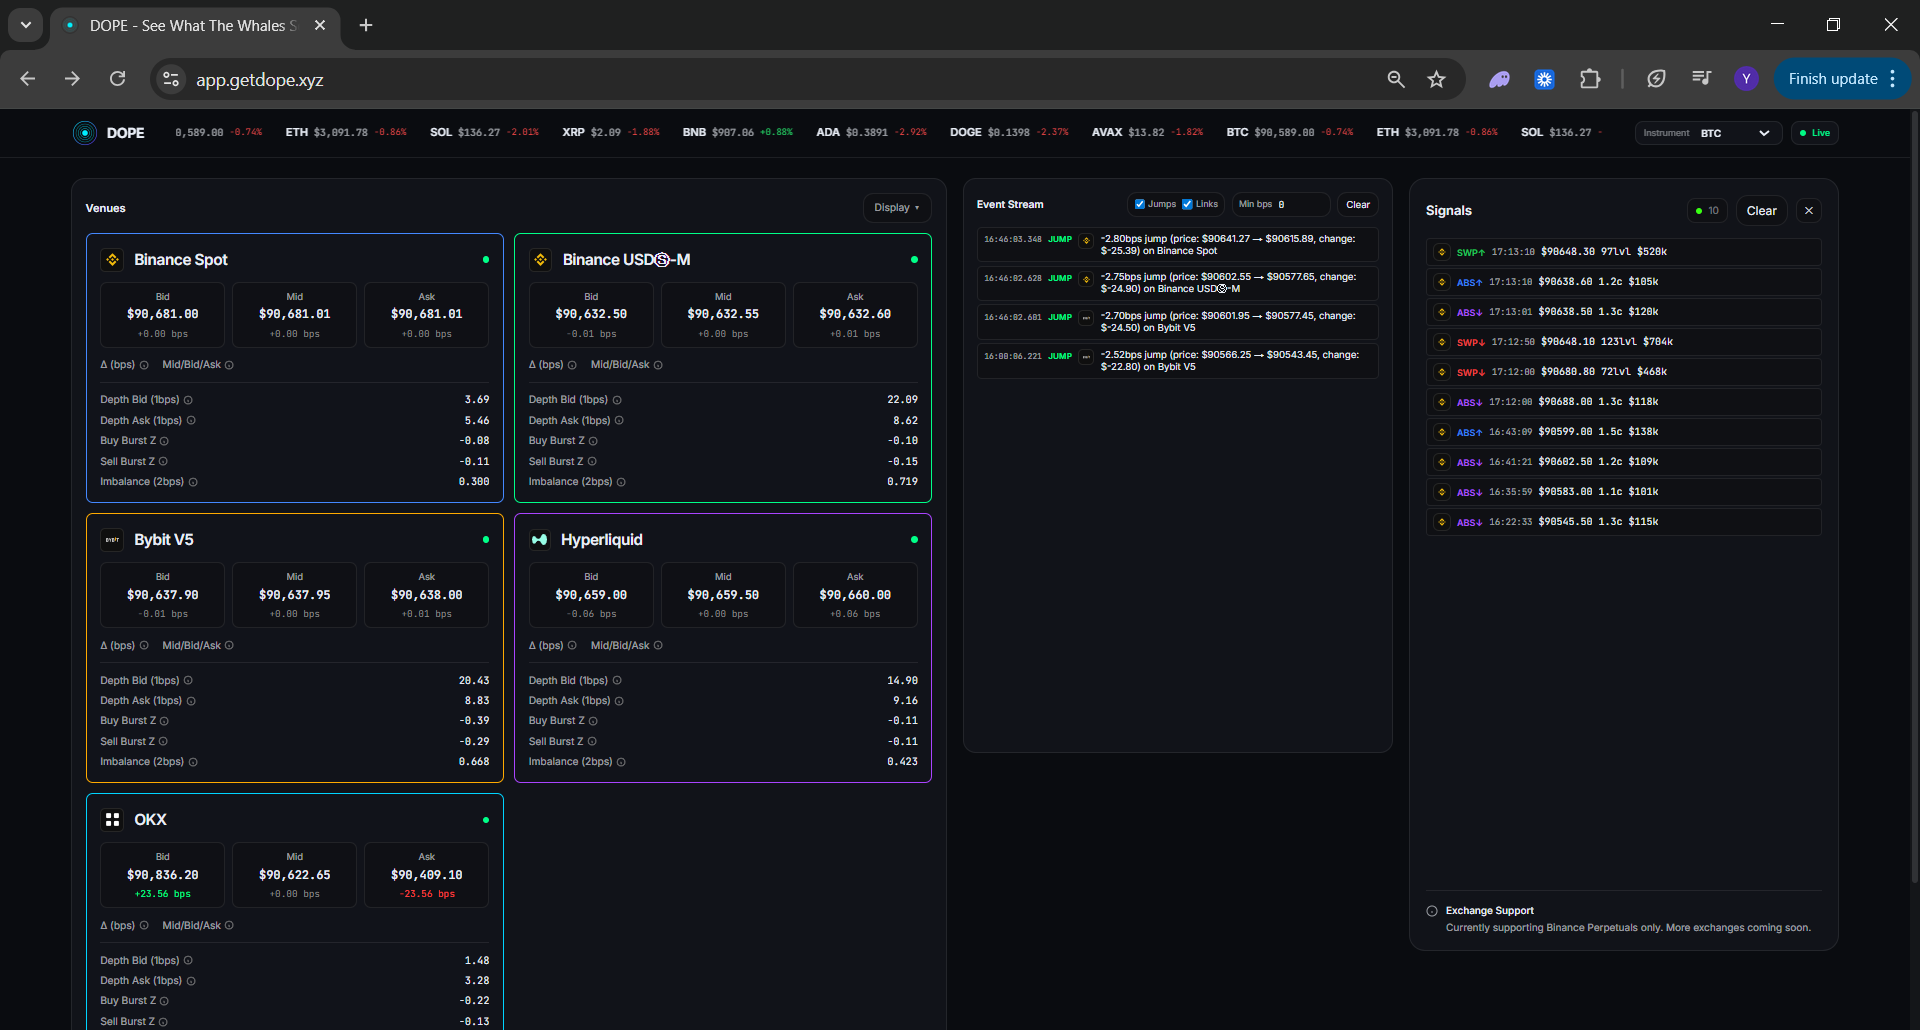
1. Understanding the Dashboard

The DOPE dashboard consists of three main panels: Venues, Event Stream, and Signals.

Full DOPE dashboard overview showing venues, event stream, and signals panel
Venues Panel: Shows real-time prices from multiple exchanges side-by-side
Event Stream: Displays detected lead-lag patterns and price jumps
Signals Panel: Shows sweeps and absorptions from order flow analysis

2. Reading Venue Cards

Each venue card displays real-time market data from a specific exchange. Understanding these metrics is key to using DOPE effectively.
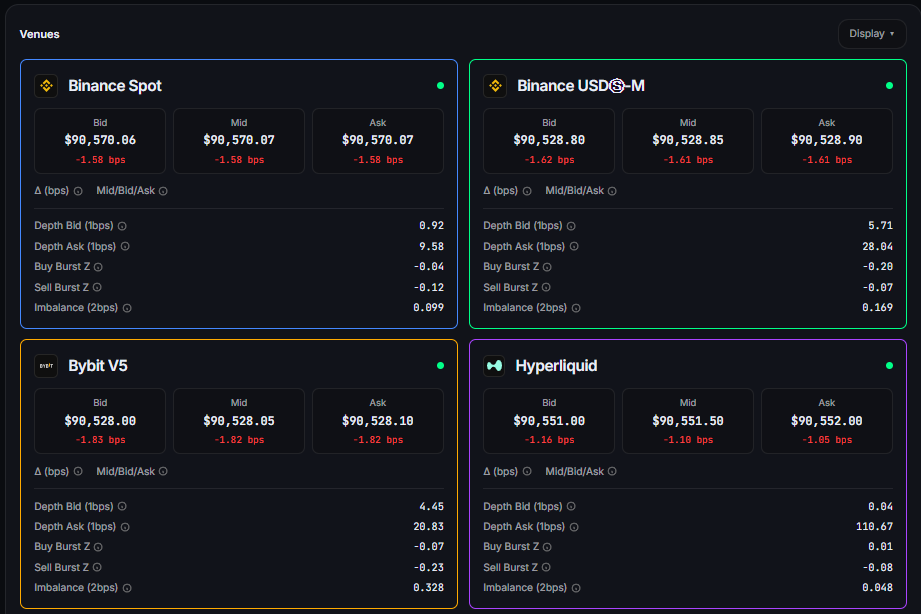
Detailed venue cards showing bid/mid/ask prices, depth metrics, imbalance, and burst Z-scores for each exchange

Bid/Mid/Ask Prices

Current best bid, mid price (average), and best ask. The delta shows price change in basis points since the reference point.

Depth Metrics

Order book depth within 1 basis point on both sides. Higher depth indicates stronger support/resistance.

Burst Z-Scores

Measures unusual trading volume. Positive buy burst indicates aggressive buying, negative indicates selling pressure.

Imbalance

Ratio of bid to ask volume. Values above 0.5 suggest buy pressure, below 0.5 suggests sell pressure.

3. Interpreting Events

The Event Stream shows two types of events: Jumps and Links. Understanding these helps you spot trading opportunities.
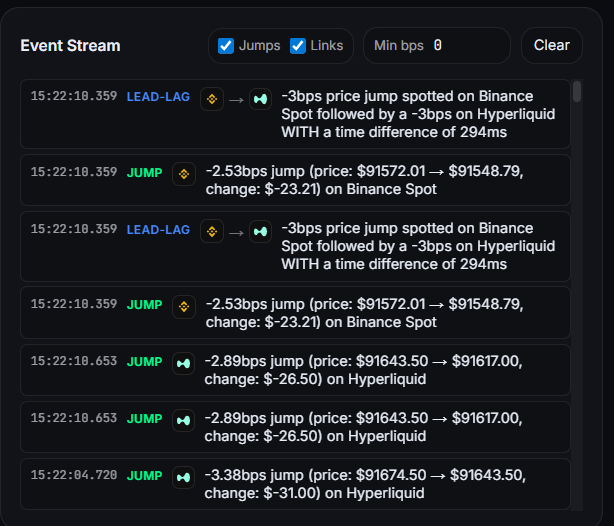
Event stream showing jump and LEAD-LAG link events with timestamps, price changes, and time differences between exchanges

Jumps

A jump is a sudden price movement on a single exchange. Large jumps (5+ bps) often indicate significant market activity. Learn more about jump detection.

Links (Lead-Lag)

A link shows a price movement on one exchange (leader) followed by a similar movement on another exchange (follower). Read our lead-lag guide for details.

4. Using Filters

Customize what you see using the built-in filters. Focus on the data that matters most to your trading strategy.

Venue Display: Show/hide specific exchanges to focus on relevant markets
Event Filters: Toggle jumps and links, set minimum basis point thresholds
Min BPS: Filter events by magnitude — only show significant price movements

Next Steps